
Applicazione di richiesta di informazioni sulla regolamentazione dei broker globali
WikiFX
English
简体中文
繁體中文
English
Pусский
日本語
ภาษาไทย
Tiếng Việt
Bahasa Indonesia
Español
हिन्दी
Filippiiniläinen
Français
Deutsch
Português
Türkçe
한국어
العربية
FPG TSLA Market Report September 23, 2025
Sommario:Tesla (TSLA) has experienced a strong bullish breakout after consolidating in the 285–358 range for several months. The price surged sharply past the 409.24 resistance and is now testing the upper zon
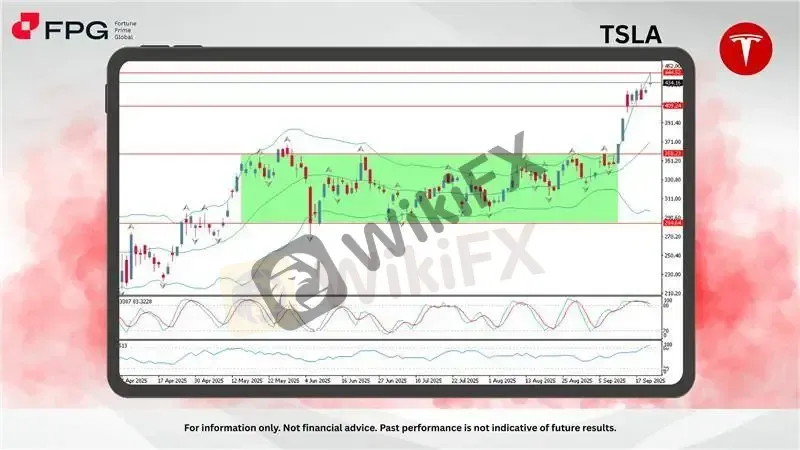
Tesla (TSLA) has experienced a strong bullish breakout after consolidating in the 285–358 range for several months. The price surged sharply past the 409.24 resistance and is now testing the upper zone at 444.52. The breakout has been supported by strong momentum, confirming a shift in sentiment from neutral to bullish.
Momentum indicators are showing overbought conditions. The Stochastic oscillator is near the upper boundary, while the MFI at 89 indicates that buying pressure is elevated and nearing an extreme. While this signals strong bullish dominance, it also raises the risk of a near-term pullback or consolidation as traders may start taking profit.
Looking ahead, if TSLA sustains above 444.52, the bullish run could extend further with upside potential toward the 450–460 zone. On the downside, any rejection below 444.52 may lead to a correction toward the breakout level at 409.24, which now acts as strong support. Price action in the coming sessions will be crucial in determining whether the current momentum can carry TSLA higher or if a retracement is due.
Market Observation & Strategy Advice:
1. Current Position: TSLA is trading near 434 after a strong breakout from the previous consolidation zone. The stock is pushing toward the upper resistance, showing strong bullish momentum.
2. Resistance Zone: Immediate resistance is at 444.52. A breakout above this level could open the way toward the 450–460 zone.
3, Support Zone: First support lies at 409.24, followed by stronger support at 358.23 if price corrects deeper.
4. Indicators: Stochastic is in overbought territory, signaling a potential pullback. MFI at 89 also reflects overbought conditions, suggesting demand is stretched. Bollinger Bands are expanding, confirming heightened volatility and strong upward momentum.
5. Trading Strategy Suggestions:
Bullish Scenario: If TSLA breaks and sustains above 444.52, momentum could carry the stock higher toward the 450–460 zone. Traders may consider long positions above this level, with tight stops below 434 to manage risk.
Bearish Scenario: A failure to break 444.52 followed by rejection may trigger a pullback. Price could retrace toward 409.24 as the first support. A break below 409.24 would expose further downside toward 358.23.
Neutral Scenario: If TSLA consolidates between 434 – 444.52, it may enter a short-term sideways phase. Traders should wait for a decisive breakout or breakdown before committing to new positions.
Market Performance:
Stocks Last Price % Change
AAPL 256.08 +4.31%
NFLX 1,227.37 +0.03%
Today's Key Economic Calendar:
DE: HCOB Manufacturing PMI Flash
UK: S&P Global Manufacturing & Services PMI Flash
US: Fed Chair Powell Speech
Risk Disclaimer This report is for informational purposes only and does not constitute financial advice. Investments involve risks, and past performance does not guarantee future results. Consult your financial advisor for personalized investment strategies.
Disclaimer:
Le opinioni di questo articolo rappresentano solo le opinioni personali dell’autore e non costituiscono consulenza in materia di investimenti per questa piattaforma. La piattaforma non garantisce l’accuratezza, la completezza e la tempestività delle informazioni relative all’articolo, né è responsabile delle perdite causate dall’uso o dall’affidamento delle informazioni relative all’articolo.
WikiFX Trader
XM
Sotto supervisione
EC Markets
Sotto supervisione
Plus500
Sotto supervisione
FOREX.com
Supervisione del paese
TMGM
Sotto supervisione
STARTRADER
Sotto supervisione
XM
Sotto supervisione
EC Markets
Sotto supervisione
Plus500
Sotto supervisione
FOREX.com
Supervisione del paese
TMGM
Sotto supervisione
STARTRADER
Sotto supervisione
Rate Calc
USD

CNY
Tasso di cambio attuale: 0
inserisci l'importo
USD
A disposizione
CNY
Calcolare