
Applicazione di richiesta di informazioni sulla regolamentazione dei broker globali
WikiFX
English
简体中文
繁體中文
English
Pусский
日本語
ภาษาไทย
Tiếng Việt
Bahasa Indonesia
Español
हिन्दी
Filippiiniläinen
Français
Deutsch
Português
Türkçe
한국어
العربية
Testing the waters after a failed break - Week 38 | Technical Analysis by Jasper Lawler
Sommario:Weekly thoughtsWhen markets fail to break down at a long-term support, it often speaks louder than if they had.Thats whats happened to the US dollar vs multiple currencies - and I have three of our fa
Weekly thoughts
When markets fail to break down at a long-term support, it often speaks louder than if they had.
That's what's happened to the US dollar vs multiple currencies - and I have three of our favourite examples (setups) this week.
I also want to renew last week‘s discussion. Namely, how to pull the ’trigger.
We have a theory i.e. we think something is setting up in the market
- in this case, a (at least temporary) bottom in the US dollar.
Theories need testing.
So, how do we test it?
We test it in the market by trading - theres no other way.
First, lets discuss the setup.
A failed breakdown
When a market tests support but cant break, that failure itself is the signal. It shows demand stepping in each time price dips.
In a downtrend, sellers should control. If they can‘t push through the lows, they’re losing control — maybe briefly, maybe longer.
Think of big institutions: they buy at support while others sell, pushing price up. They wait for price to return and buy again — thats support at work.
A false breakdown is a sneakier version. Market makers push price below support to trigger stops, creating liquidity for large buyers. Once filled, selling dries up and price snaps back.
Thats the essence of a failed breakdown: less real bearish conviction, more about clearing stops.
For traders, it signals control shifting from sellers to buyers. On charts, look for a fake low, momentum turning higher, and short-term consolidation (wedge, triangle, or range) before probing higher.
The trigger and execution tactics
This is where the art of trading meets the signal.
What we advocate is ‘testing the market’.
Test the waters at market
Enter a small starter position around current levels. The idea is that if the market is ready to take off, you want early exposure.
Quick exit on failed test
If price doesnt show that early momentum i.e. it quickly rolls over, then exit without hesitation. No harm in cutting small.
Buy the retest
Should price pull back towards near term support or a demand zone, watch for a bullish candlestick (engulfing, pin bar) to confirm entry.
Exit again if wrong
If the support level doesnt hold, cut your losses and move on.
Scale in if right
If the move higher develops, youre already positioned. Add on strength — for instance, on a breakout of resistance or out of a chart pattern.
As usual, we could be wrong that the US dollar has bottomed. It‘s famously difficult to call a bottom in any market until after the fact! That’s why we have stop losses..
And if the US dollar can‘t find a bid, there are some other charts that look good - NOK/USD is one our fav’s mentioned in week 35.
Setups & signals
We look at hundreds of charts each week and present you with three of our favourite setups and signals.
USD/CHFSetup
The 0.80 level is a big one for the Swiss franc. Last weeks candle was a hammer pattern and a bullish sign 0.80 could eventually hold as support.
Signal
A failed breakdown seen better on the daily chart has the price sitting inside a triangle pattern with bullish RSI divergence. A breakout above the triangle could confirm the long term level has held.
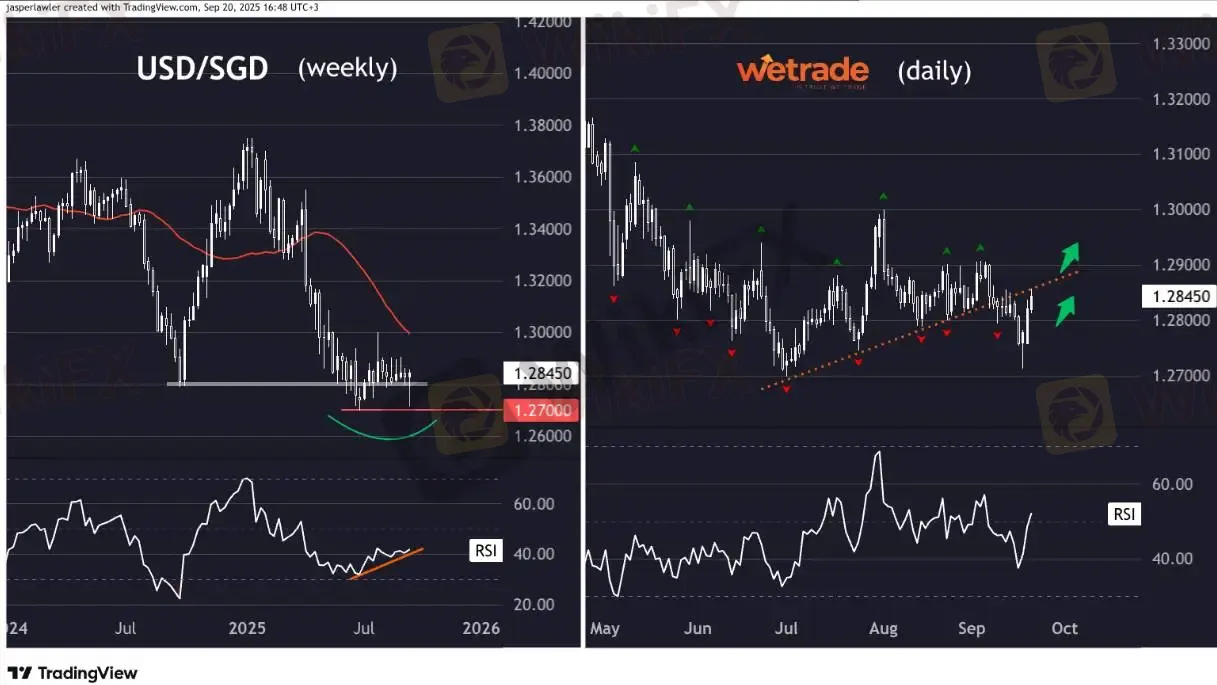
USD/SGDSetup
Signal
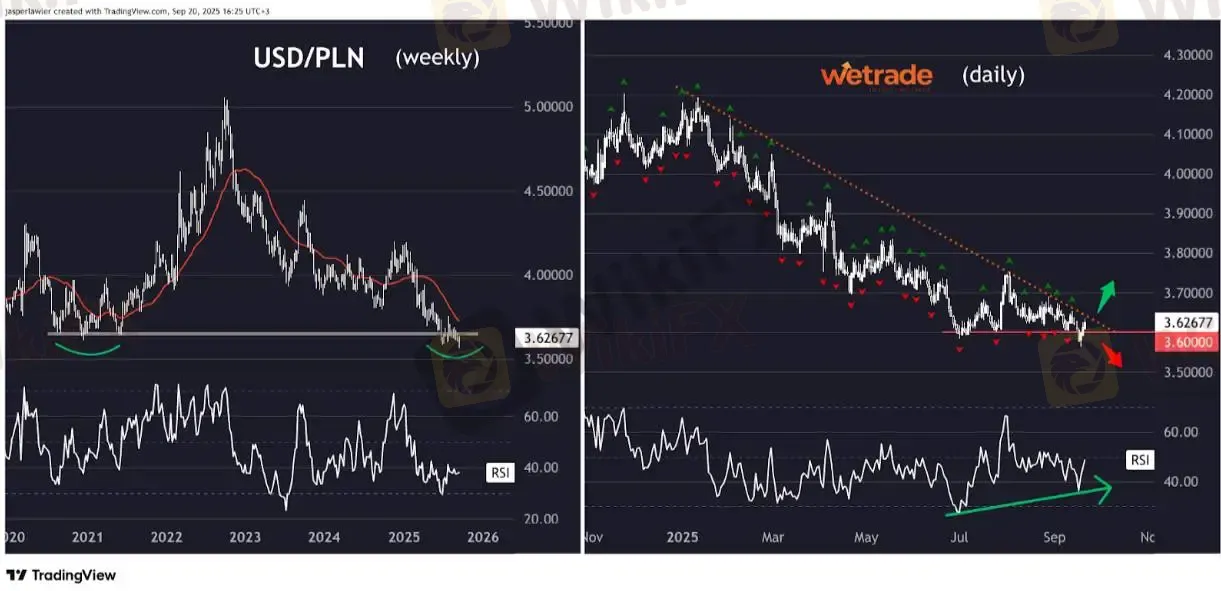
USD/PLNSetup
Signal

Big support from last year was 1.28. This year the price got down to 1.27 twice but both times it didnt last long.
The price is retesting a broken rising trendline and could fall back as bears sell the retest. However any drop back towards 1.28 could be an opportunity to get bullish at lower prices, while a push back above the trendline could be a bullish confirmation.
The Polish Zloty is setting up a possible double bottom with its 2021 low. 1.36 is the big round number to watch.
A false breakdown could be the first sign of a bullish recovery. A break back over the downtrend line could offer confirmation the bottom is in.
But - as always - thats just how the team and I are seeing things, what do you think?
Disclaimer:
Le opinioni di questo articolo rappresentano solo le opinioni personali dell’autore e non costituiscono consulenza in materia di investimenti per questa piattaforma. La piattaforma non garantisce l’accuratezza, la completezza e la tempestività delle informazioni relative all’articolo, né è responsabile delle perdite causate dall’uso o dall’affidamento delle informazioni relative all’articolo.
WikiFX Trader
JustMarkets
Sotto supervisione
EC Markets
Sotto supervisione
Vantage
Sotto supervisione
Exness
Sotto supervisione
GTCFX
Sotto supervisione
D prime
Sotto supervisione
JustMarkets
Sotto supervisione
EC Markets
Sotto supervisione
Vantage
Sotto supervisione
Exness
Sotto supervisione
GTCFX
Sotto supervisione
D prime
Sotto supervisione
Rate Calc
USD

CNY
Tasso di cambio attuale: 0
inserisci l'importo
USD
A disposizione
CNY
Calcolare