
Applicazione di richiesta di informazioni sulla regolamentazione dei broker globali
WikiFX
English
简体中文
繁體中文
English
Pусский
日本語
ภาษาไทย
Tiếng Việt
Bahasa Indonesia
Español
हिन्दी
Filippiiniläinen
Français
Deutsch
Português
Türkçe
한국어
العربية
Physical Gold Supply Disruption: Not Enough to Fuel a Major Price Rally
Sommario:Freeport-McMoRans Suspension at Grasberg MineFreeport-McMoRan announced that operations at its Grasberg mine in Indonesia remain suspended after a fatal landslide, significantly impacting production.
Freeport-McMoRans Suspension at Grasberg Mine
Freeport-McMoRan announced that operations at its Grasberg mine in Indonesia remain suspended after a fatal landslide, significantly impacting production. The shutdown is expected to reduce Freeports third-quarter copper and gold sales by roughly 4% and 6%, respectively, compared with its July forecast.
Looking ahead, the company now projects that PT Freeport Indonesias 2026 output could fall about 35% short of earlier estimates of 1.7 billion pounds of copper and 1.6 million ounces of gold. Based on its staged restart plan, normal production rates may not resume until 2027.
Grasberg, a large porphyry copper-gold deposit, produces significant quantities of gold and silver as by-products of copper mining. While the copper supply shock has a direct effect on global industrial metals markets—tightening both spot and forward balances—the impact on gold and silver prices is less pronounced, given their more diversified global supply sources (gold from recycling and central bank reserves, silver from copper, lead, and zinc mines). Thus, the effect is largely limited to Freeports earnings and localized market conditions.
Chart 1. Discovery of Copper Deposits at Grasberg (1936) />
Chart 1. Discovery of Copper Deposits at Grasberg (1936)(In 1936, geologists confirmed the site contained large reserves of copper.)
Gold Demand Dynamics
As shown in Chart 2, the blue bars represent jewelry demand. With gold prices surging, physical consumption has fallen, with Q1 and Q2 2025 showing the sharpest declines.
The red bars represent technology demand, which has historically remained stable and can be largely disregarded as a major driver of gold prices.
The yellow bars represent investment demand, accounting for 20%–30% of total demand. Gold has rallied nearly 40% year-to-date, primarily driven by investment flows. Unlike in 2022, when central bank purchases fueled the rally, Q2 2025 saw a contraction in central bank demand. This suggests that future price action will remain dominated by investment flows, with a gradual return to macroeconomic fundamentals.
Chart 2. Breakdown of Gold Demand Components />
Chart 2. Breakdown of Gold Demand Components
Source: MacroMicro
Gold Technical Outlook
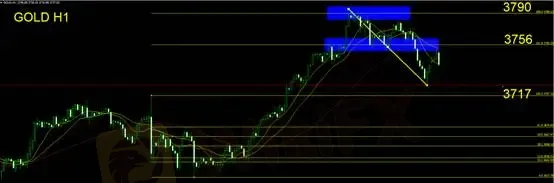
In earlier technical commentary, we identified Fibonacci external extension targets at 1.618 (3756) and 2.00 (3786). Gold prices ultimately peaked near 3786 before reversing lower.
On the daily chart, prices rebounded after testing the 5-day moving average (5MA), consistent with previous retracement behavior. Intraday focus remains on 3717—a break below this level could extend bearish momentum toward 3627, the prior short-term rally base.
Meanwhile, the U.S. Dollar Index, following the Feds quarter-point rate cut, initially fell before rebounding. The index is now shaping a double-bottom formation, raising the possibility of an upward breakout above the neckline.
Trading Strategy:
Maintain a bearish bias.
Traders holding short positions should keep protective stops at breakeven.
New entries should wait for confirmation of a downside reversal on the hourly chart. Suggested stop-loss at 3780.
Risk Disclaimer:
The above views, analyses, and data are provided for general market commentary only. They do not represent the stance of this platform. Readers assume all risks associated with trading decisions. Exercise caution.
Disclaimer:
Le opinioni di questo articolo rappresentano solo le opinioni personali dell’autore e non costituiscono consulenza in materia di investimenti per questa piattaforma. La piattaforma non garantisce l’accuratezza, la completezza e la tempestività delle informazioni relative all’articolo, né è responsabile delle perdite causate dall’uso o dall’affidamento delle informazioni relative all’articolo.
WikiFX Trader
Plus500
Sotto supervisione
Ultima Markets
Sotto supervisione
FXCM
Sotto supervisione
octa
Sotto supervisione
EC Markets
Sotto supervisione
GTCFX
Sotto supervisione
Plus500
Sotto supervisione
Ultima Markets
Sotto supervisione
FXCM
Sotto supervisione
octa
Sotto supervisione
EC Markets
Sotto supervisione
GTCFX
Sotto supervisione
Rate Calc
USD

CNY
Tasso di cambio attuale: 0
inserisci l'importo
USD
A disposizione
CNY
Calcolare