
Applicazione di richiesta di informazioni sulla regolamentazione dei broker globali
WikiFX
English
简体中文
繁體中文
English
Pусский
日本語
ภาษาไทย
Tiếng Việt
Bahasa Indonesia
Español
हिन्दी
Filippiiniläinen
Français
Deutsch
Português
Türkçe
한국어
العربية
January FMS Fund Manager Positioning
Sommario:Fund Manager Survey (FMS) participants are predominantly long-only funds, positioning them as price setters in the market. The FMS report offers valuable insight into how global fund managers currentl
Fund Manager Survey (FMS) participants are predominantly long-only funds, positioning them as price setters in the market. The FMS report offers valuable insight into how global fund managers currently view the economic outlook and how they are allocating capital.
The January FMS survey was conducted between January 9–15, covering 227 fund managers with total assets under management (AUM) of USD 646 billion.
Cash Levels at Historical Lows Signal Strong Risk Appetite
Fund managers cash allocations declined further to 3.2%, down from 3.3% in the previous month, marking one of the lowest levels on record. This reflects an exceptionally optimistic market sentiment.
Unless a systemic risk event triggers a market drawdown exceeding 20%, long-only funds are unlikely to engage in meaningful deleveraging or forced selling.
")
(Figure 1: Cash Allocation Falls to 3.2% | Source: BofA)Positioning Skewed Toward Cyclicals, Tech Exposure Remains Light
Despite extremely low cash levels, fund positioning is concentrated in commodities, banks, utilities, emerging markets, and healthcare. From a Z-score perspective, allocations to technology stocks remain relatively low. Compared with historical positioning, technology exposure stands at –0.2 standard deviations.
Overweight positions currently include commodities, banks, the euro, utilities, emerging markets, healthcare, and telecom stocks, indicating crowded trades across these sectors.
Given that the market has entered a new AI-driven technology cycle, and technology stocks continue to lead U.S. equity performance, this positioning imbalance leaves significant room for future reallocation back into technology.
")
(Figure 2: January Positioning Z-Score Distribution | Source: BofA)Macro Outlook: No-Landing Narrative Gains Ground
At the macro level, 49% of FMS respondents now expect a “no-landing” scenario for the global economy, while expectations for a soft landing declined to 44%, down from 57% last month.
This shift reflects the Federal Reserves RMP short-term Treasury repurchase operations, which have helped improve liquidity conditions and stabilize the macro investment environment.
")
(Figure 3: Global Economic Outlook Expectations | Source: BofA)Crowded Trades: Gold Tops the List
According to the survey, the top three most crowded trades are:
Long gold
Long the Magnificent Seven
Short the U.S. dollar
Gold Technical Analysis
Trading Strategy
SUP1: 4,642
Resistance 1: 4,890
Risk Disclaimer
More than half of FMS respondents now view long gold positions as increasingly crowded. While the Magnificent Seven remain classified as a crowded trade, the proportion has declined to 27%, while short USD positioning edged up slightly to 7%.
These expectations reinforce our view that gold longs are overheating. Although the survey did not disclose explicit gold positioning, the heavy allocation toward commodities suggests that recent price strength in copper, aluminum, and silver has likely driven much of the sector exposure. As a result, gold may represent a smaller portion of overall commodity allocations.
In other words, if a broad-based commodity sell-off were to occur, a resonance effect across the sector is likely. Under such circumstances, a rotation back into technology stocks would be a reasonable outcome.
With the U.S. earnings season approaching, strong earnings growth from technology and growth stocks could serve as a catalyst for FMS managers to rebuild technology exposure.
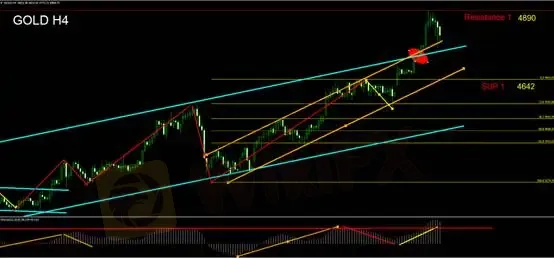
Based on a 4-hour chart, gold has broken above both the medium-term ascending channel (blue) and the short-term ascending channel (orange). Price entered an overbought zone, reaching a high near USD 4,890 per ounce before pulling back. During the Asian session, prices retested the upper boundary of the larger long-term trend channel (blue).
Momentum indicators, including MACD, remain largely unchanged and continue to signal overheated conditions.
With daily volatility near USD 100, short-term trading requires wider stop-loss levels and reduced position sizing. While there is currently no clear confirmation of a trend reversal to the downside, the probability of mean reversion toward the daily 5-day moving average is increasing.
Investors should remain alert to potential selling pressure as safe-haven demand fades, which could lead to a price pullback.
Remain sidelined; no active positioning recommended.
Support
Resistance
The views, analyses, research, prices, and other information provided above are for general market commentary only and do not represent the position of this platform. All readers assume full responsibility for their own investment decisions and associated risks. Please trade with caution.
Disclaimer:
Le opinioni di questo articolo rappresentano solo le opinioni personali dell’autore e non costituiscono consulenza in materia di investimenti per questa piattaforma. La piattaforma non garantisce l’accuratezza, la completezza e la tempestività delle informazioni relative all’articolo, né è responsabile delle perdite causate dall’uso o dall’affidamento delle informazioni relative all’articolo.
WikiFX Trader
OANDA
Supervisione del paese
STARTRADER
Sotto supervisione
VT Markets
Sotto supervisione
FXTM
Sotto supervisione
AVATRADE
Sotto supervisione
FXCM
Sotto supervisione
OANDA
Supervisione del paese
STARTRADER
Sotto supervisione
VT Markets
Sotto supervisione
FXTM
Sotto supervisione
AVATRADE
Sotto supervisione
FXCM
Sotto supervisione
Rate Calc
USD

CNY
Tasso di cambio attuale:0
inserisci l'importo
USD
A disposizione
CNY
Calcolare