Abstract:Start the week of February 21, 2022 with our Forex forecast focusing on major currency pairs here
EUR/USD
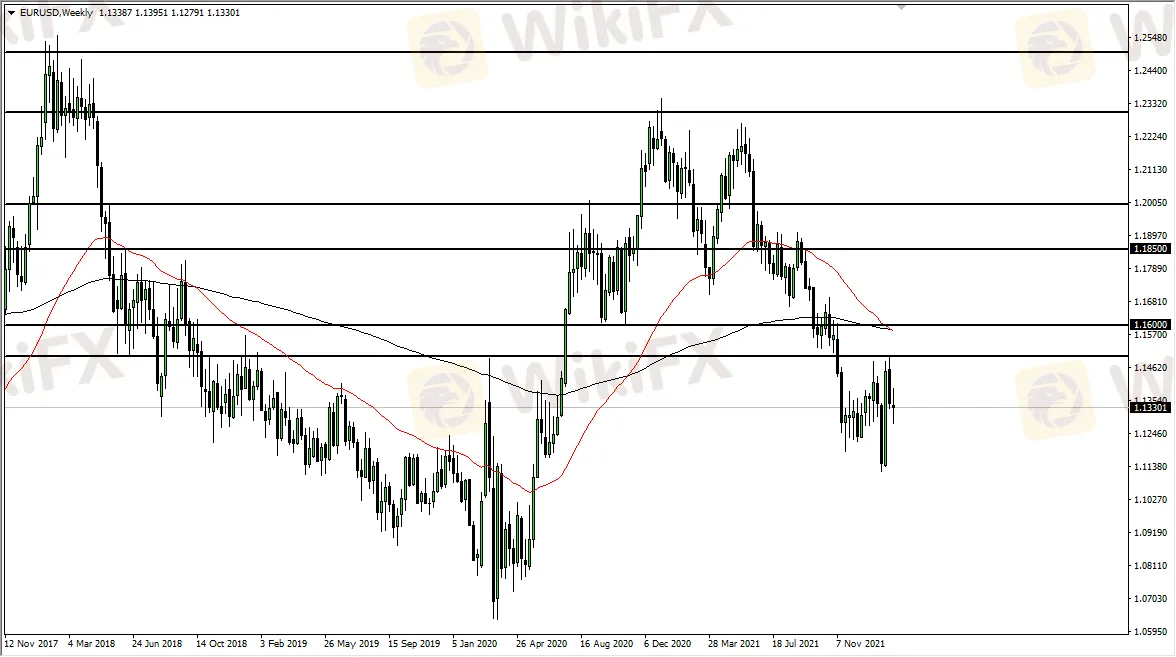
The euro went back and forth last week, which is not a huge surprise considering that we have been moving on the latest rumors or blurbs from the Ukrainian frontier. Ultimately, this is a market that looks as if it is trying to form some type of trading range that we can get involved in, with the 1.15 level above offering obvious resistance, and the 1.12 level underneath being an area of support.
Keep in mind that depending on whether the news is good or bad, that will either lift or sink this market. The tensions calming down in Ukraine would of course help this market, but I do not know how much further we can go to the upside due to the fact that interest rate differential still favors the US dollar.

GBP/JPY
The British pound continues to be very noisy against the Japanese yen as we also have a lot of concerns when it comes to geopolitics, and that makes a huge impact on what we have going on here. The British pound rallying will be a sign of “risk on”, while the Japanese yen is a safety currency. The ¥155 level underneath should be support, while the ¥158 level above could be resistance. With that being the case, we will continue to move on the latest rumor or tweet about Ukraine.
USD/CAD
The United States dollar initially pulled back against the trading week, just as we have seen over the last several weeks. Now we have turned around to form a bit of a hammer, just as we had the previous two candlesticks. With that being said, if we can break above the 1.28 level, then it is likely we could go looking towards 1.30 level. If we break above the 1.30 level, then it is likely that we go much higher. Keep in mind that the Canadian dollar has underperformed, despite the fact that oil has been rallying.

AUD/CAD
The Australian dollar has rallied a bit during the week, but it is obvious that the downtrend line will come into the picture next. If you look at the chart, you can see that this downtrend line has been very reliable over the last several months, and at this point it still looks as if we are going to continue that pattern.


