


UK Retail Sales July 2026 Fall 0.5%: What the Result Means for GBP
UK retail sales fell 0.5% in July 2026, while the three-month measure rose 1.1%. See the ONS details and what the mixed result may mean for GBP.
Original

简体中文
繁體中文
English
Pусский
日本語
ภาษาไทย
Tiếng Việt
Bahasa Indonesia
Español
हिन्दी
Filippiiniläinen
Français
Deutsch
Português
Türkçe
한국어
العربية
اردو




Abstract:In forex trading, chart patterns are more than just shapes on a graph. One of the most powerful bullish continuation patterns is the ascending triangle. This formation doesn’t simply happen by chance; it’s a result of specific psychological dynamics at play among buyers and sellers. Understanding the reasoning behind this pattern can help traders make informed decisions and improve their chances of profitability.

In forex trading, chart patterns are more than just shapes on a graph. One of the most powerful bullish continuation patterns is the ascending triangle. This formation doesn‘t simply happen by chance; it’s a result of specific psychological dynamics at play among buyers and sellers. Understanding the reasoning behind this pattern can help traders make informed decisions and improve their chances of profitability.
 Contents
The ascending triangle is a chart pattern characterized by:
Typically, the pattern forms during an existing uptrend, signaling a possible continuation once a breakout occurs above resistance.
The formation of an ascending triangle reflects a gradual shift in market sentiment, with buyers increasingly taking control. Here‘s what’s happening beneath the surface:
1. Strong Resistance and the Battle for Breakout
The horizontal resistance level represents a price point where sellers are consistently willing to take profits or open short positions. Each time the market reaches this level, selling pressure temporarily outweighs buying pressure, causing a pullback.
However, the repeated testing of this resistance sends a message to market participants: the sellers control is weakening, and buyers are persistent.
2. Higher Lows Show Growing Confidence
The rising trendline of higher lows indicates that buyers are stepping in earlier with each dip, unwilling to wait for prices to drop lower. This is a clear sign of bullish sentiment. Traders interpret higher lows as evidence of increasing demand and a shrinking supply of sellers.
3. Pressure Builds Like a Spring
As price action squeezes between the rising support and the fixed resistance, market energy is compressed. This “pressure build-up” often leads to an explosive breakout once the resistance finally gives way. The breakout tends to be strong because many traders — from short-term scalpers to long-term investors — enter the market simultaneously.
4. Breakout Psychology
When the resistance is decisively broken, it signals a shift in control from sellers to buyers. Traders who were previously short may rush to cover their positions (buying back), adding more fuel to the move. At the same time, breakout traders enter new long positions, accelerating upward target="_blank" kwlink="6384064000816950219725">target="_blank" kwlink="6384064001486602547789">momentum.
Understanding the psychology of the ascending triangle is the first step. The second is translating that knowledge into actionable trading strategies:
The ascending triangle in forex is a snapshot of shifting market psychology. As buyers grow more confident and sellers lose ground, the market builds up pressure that often results in a strong upward breakout. Traders who understand the human behavior behind this pattern can better anticipate movements, manage risk effectively, and seize profitable opportunities when the market tips in their favor.

Disclaimer:
The views in this article only represent the author's personal views, and do not constitute investment advice on this platform. This platform does not guarantee the accuracy, completeness and timeliness of the information in the article, and will not be liable for any loss caused by the use of or reliance on the information in the article.
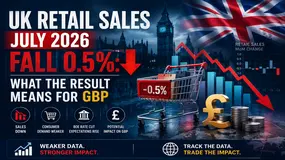
UK retail sales fell 0.5% in July 2026, while the three-month measure rose 1.1%. See the ONS details and what the mixed result may mean for GBP.

Pakistan forex reserves stood at $22.506 billion on 13 August 2026, while the SBP dashboard showed a USD/PKR mark to market rate of 277.5713 on 20 August. This article separates the SBP forex reserves facts from predictions about the Pakistan rupee and the forex market Pakistan.

A multi-asset liquidity solution can help a broker support FX, CFDs, commodities, and indices through a more unified operating model. But adding asset classes can also create fragmented symbols, pricing, routing, margin rules, records, and client messages if controls are not designed first. This 2026 guide explains how a multi asset liquidity provider, forex CFD liquidity setup, commodity liquidity provider, and indices liquidity provider fit into a broker-owned execution service. It outlines the due-diligence questions, shared-control model, cost drivers, and 90-day implementation plan that help teams expand without making the execution chain harder to explain. The aim is not to promise deeper liquidity or better trading outcomes. It is to create evidence that a broker can supervise market access, trace order events, reconcile costs, and communicate consistently to the relevant clients when conditions are difficult.

Gold surged above $4,500 after the US Treasury expanded its purchases of longer-dated government bonds, pushing yields and the dollar lower. But this was not debt forgiveness or Federal Reserve money printing—it was a liquidity operation that exposed a much bigger fear: America may be finding it increasingly difficult to live with market-driven interest rates.
WikiFXWikiFXWikiFXWikiFXWikiFXWikiFXWikiFXWikiFXWikiFXWikiFX