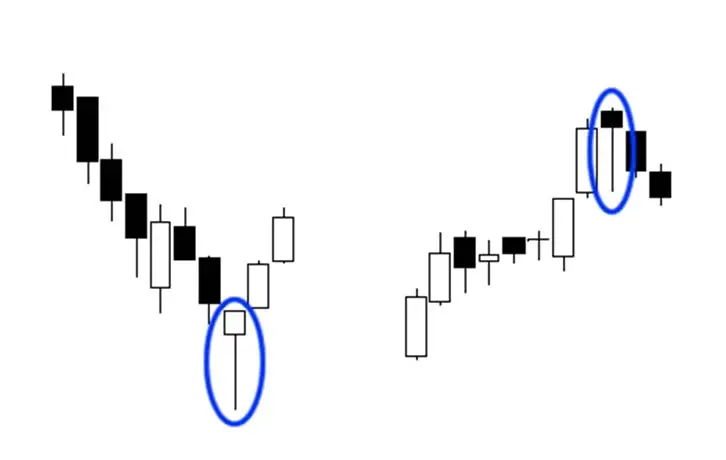
Single Candlestick Patterns
let's move on to individual candlestick patterns. If these candles are displayed on the chart, they may indicate a potential market reversal. The four basic single Japanese candlestick patterns are:

let's move on to individual candlestick patterns. If these candles are displayed on the chart, they may indicate a potential market reversal. The four basic single Japanese candlestick patterns are:

Like humans, candlesticks have different body sizes. And when it comes to forex trading, there's nothing worse than looking at the candlestick itself!

While we discussed Japanese candlestick charting analysis briefly in the previous forex class, we'll now go over it in greater depth.

The peak reached before the price falls back is now resistance when it moves up and then retracts. As the price climbs back up, the lowest position hit before the climb is now considered support.

As the name implies, one approach for trading support and resistance levels is soon after the rebound. Many Forex retail traders make the mistake of placing an order at a bullish level and then sitting down and waiting for the transaction to be executed.

We may establish a "channel" by extending the trend line hypothesis and drawing a parallel line at the same angle as the uptrend or downturn.

In forex trading, trend lines are the most often used type of technical analysis. They're also one of the most obscure. They can be as exact as any other approach if drawn correctly. Most forex traders, unfortunately, draw them improperly or try to make the line represent the market instead of the other way around.

One of the most often used trading ideas is "support and resistance." Surprisingly, everyone appears to have their own opinion on how support and resistance should be measured.