Abstract:Confused about how to track your forex profits? The secret lies in the charts—and we’re here to decode them for you.
.jpg")
Confused about how to track your forex profits? The secret lies in the charts—and were here to decode them for you.
The forex returns, in simple terms, are the differences between the selling price and purchase price of the currency you exchange to buy another.
Many factors influence the currency price, including technical elements such as forex charts. They show the price movement over a period and hint at a trend that investors can understand, allowing them to implement the perfect investment strategies aimed at enhancing their monetary value.
What is a Forex Chart?
A forex chart is simply a price chart. It is the first technical tool forex traders use to analyze price movement in currencies. You can also term it a currency market chart. It helps you visualize the trading activity that happened during different periods. They can be for minutes, hours, a day, or even a week. Currency price movement over a time period can be illustrated in a forex chart for effective analysis.
Currency prices can change in seconds, often due to unexpected news or market sentiment. Forex charts help you make sense of this chaos, offering clarity when markets turn volatile due to news or sentiment shifts. The charts representing the price changes help traders manage risk and determine probability.
The charts remain user-friendly, as you can view forex graphs that showcase price movements and patterns.
Heres a forex graph showcasing currency price fluctuations.
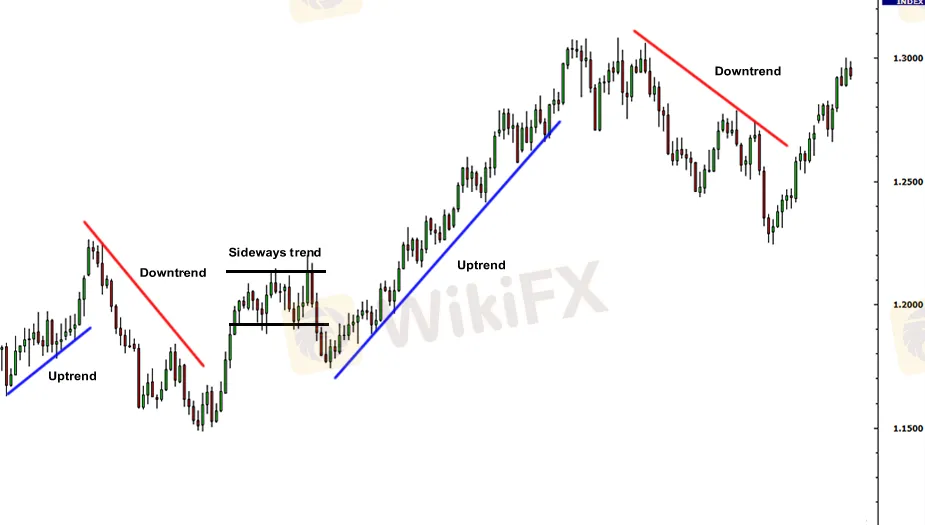
What Does the Price Chart Demonstrate?
The price chart illustrates changes in demand and supply interactions. The chart showcases purchase and sale transactions of currency pairs every second. It further demonstrates news and the expectations traders have of future news. However, if the future does not turn out as expected, the prices change again.
Charts showcase the trading activity of millions of market participants, including transactions initiated by an exporter, the central bank-induced currency intervention, or discretionary trades executed by retail traders. As a trader, you can analyze and make a strong move.
Types of Forex Charts You Should Analyze for Investment Strategies
- Line Chart
- Bar Chart
- Candlestick Chart
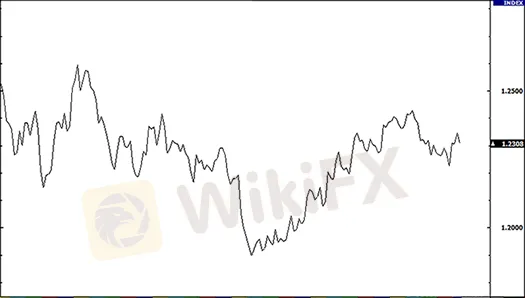
Line Chart Forex and the Inferences You Can Draw from it
Line chart forex is a simple chart that draws a line from one closing price point to the next one. Stringing this chart with a line lets traders witness the usual currency pairs price movement over a specific time period. It may be simple, however, as a trader, you cannot see the entire price behaviour during the period. You can only see the closing price for a specific period. What happened in between will be missing. Despite this deficiency, traders can check trends seamlessly and effectively compare the closing price of different periods. Trends are best demonstrated through a line chart forex.
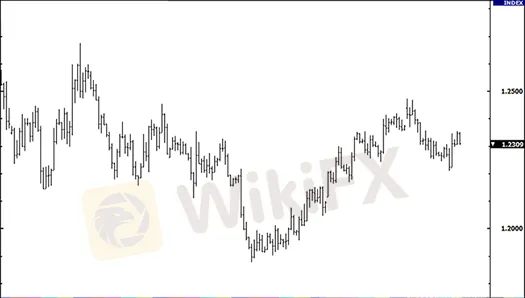
Bar Chart
A bar chart seems a bit complex as it demonstrates the opening and closing price points besides the highs and lows of trading sessions.

Bar sizes may increase or decrease depending on the type. The vertical bars bottom showcases the lowest trading price for a specified period. At the same time, the bar top demonstrates the highest price paid. The trading range of the currency pair is demonstrated in the vertical bar.
Bar sizes lengthen when price fluctuations become intense. The sizes reduce amid a relatively quiet price fluctuation. The bar size fluctuation happens based on the construction of each bar. High and low price ranges for the bar period are demonstrated through the vertical height. Opening and closing prices of the period are recorded on the price bar through horizontal lines. The opening price is presented through the horizontal hash on the left side. On the other hand, the horizontal hash on the right side represents the closing price.
Some More Details About Bar Charts
A bar represents a time segment. It can be a day, a week, or an hour.
Bar charts, also referred to as OHLC charts, demonstrate the Open, the Low, the High, and the Close for a currency pair.
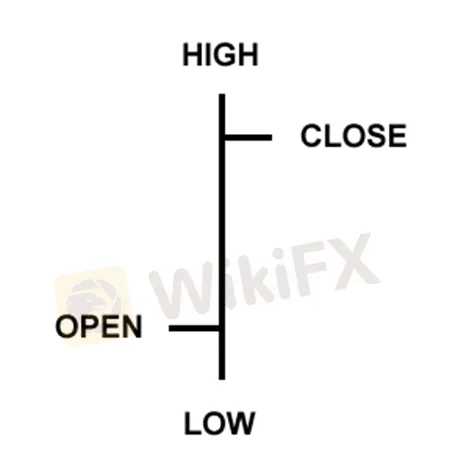
What Do These Variables Demonstrate?
Open refers to the horizontal line on the left. It is called the opening price.
High, demonstrated through the vertical line, is the highest price recorded during the time period.
Low, showcased through the vertical line at the bottom, indicates the lowest price recorded during the time period.
Close, which denotes the closing price, is represented through a little horizontal line on the right.
Candlestick Charts
The candlestick chart is another version of the bar chart with enhanced representations. Despite showing the same price details, the candlestick chart is the popular format because of its prettier and easier-to-read structure. The trends are represented in graphics to make it a visually appealing experience for users.

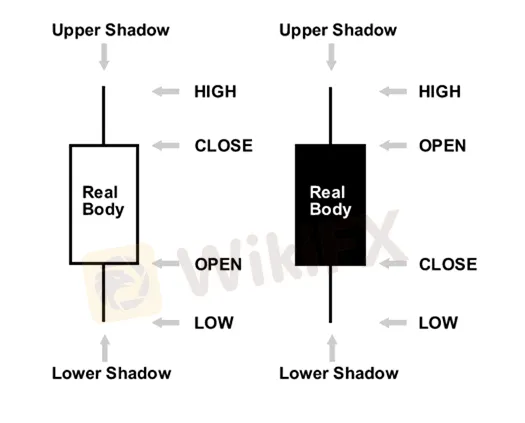
You can view the low to high price range with a vertical line on candlestick charts. However, the larger block (or body) in the middle showcases the opening and closing price ranges in candlestick charts. These charts display differently colored “bodies” to let users figure out the market sentiment - whether its bullish or bearish. If the middle block is colored or filled in, it means the closing price of the currency pair is lower than its opening price.
A More Vivid Description of Candlestick Chart
Decision Making Based on Forex Charts
Forex charts are beyond a price chart insight. They demonstrate public sentiment that largely dictates your forex returns. Understanding how the price is shaping will give you an idea of the strategy to implement. If prices are too volatile and remain that way for a long time, stay hooked and close your positions when you achieve a significant profit. If the chart shows a quiet price movement either way, stay patient and take a relatively longer position to benefit. A candlestick chart remains more elaborate, technical and appealing. It evokes more human emotions from the price movement. So, sparing more time to analyze candlestick charts will give you a more deeper view of the market movement.
Image Courtesy - BabyPips
Join our community - WikiFX Masterminds - to know what's shaping the forex market.