Divergence Cheat Sheet
Divergence is a well-known concept in technical analysis that describes when the price is moving in the opposite direction of a technical indicator. Note that divergence is not a trading signal but rather an indicator.
简体中文
繁體中文
English
Pусский
日本語
ภาษาไทย
Tiếng Việt
Bahasa Indonesia
Español
हिन्दी
Filippiiniläinen
Français
Deutsch
Português
Türkçe
한국어
العربية

Divergence is a well-known concept in technical analysis that describes when the price is moving in the opposite direction of a technical indicator. Note that divergence is not a trading signal but rather an indicator.

Divergences are one of my favorite trading concepts because they offer very reliable high-quality trading signals when combined with other trading tools and concepts.

While divergences are an excellent tool to have in your trading toolbox, there are situations when you may enter too soon since you did not wait for more confirmation.

What Is a Regular Divergence and How Do I Trade It?

Divergences can be used to indicate a probable trend reversal as well as a possible continuance of the trend (price continues to move in its current direction).

A regular divergence can be seen as a hint of a trend reversal. Bullish and bearish regular divergences are the two forms of regular divergences.

What if you were already in a long position and knew exactly when to quit, rather than watching your unrealized gains, such as a potential Aston Martin down payment or a pair of Christian Louboutin high heels, vanish before your eyes because your trade reversed direction?

In our earlier lesson we have covered Harmonic Patterns, which we said are a type of complex patterns that occur naturally in financial charts based on geometric price action and Fibonacci levels.
As you may have guessed, dealing and raking off Harmonic Price Patterns is all about having the ability to spot those “perfect” patterns and buying or selling on their completion.
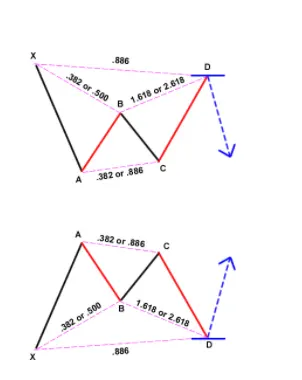
Gartley patterns are chart patterns used in technical analysis and are known for their relationship using Fibonacci numbers and ratios. Gartley pattern as One of such pattern created by a super smart trader called Harold McKinley Gartley all the way back in the 1930s. He had a stock market advisory service in the mid-1930s with a bigger following.
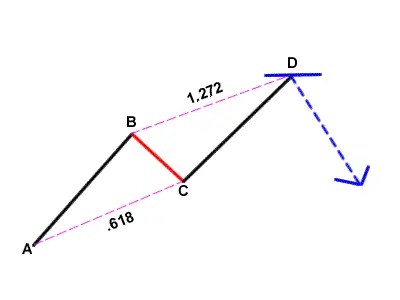
We’ll just bring in another letter at the end, and we’ve got the ABCD chart pattern as simple than you thought. To easily point this chart pattern out, all you need are sharp hawk eyes and the helpful Fibonacci chart tool.

Harmonic patterns are specific formations used in technical analysis that can help traders understand price action and forecast where prices may go next.

Fractals are fractals, and Elliott Waves are fractals. Each wave can be divided into pieces, each of which is a near-identical duplicate of the whole. This trait is referred to as "self-similarity" by mathematicians.

We'll look at some setups in this section and use our Elliott Wave expertise to establish entry, stop loss, and exit locations.

When it comes to wave labeling, there are THREE cardinal "cannot-be-broken" laws. So, before you start using Elliott Wave Theory in your trading, you should familiarize yourself with the following guidelines. Failure to accurately categorize waves could lead to a devastating consequences on your balance.
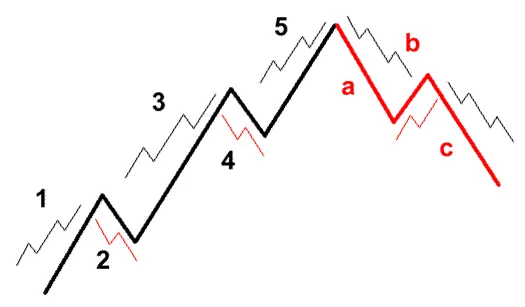
Do you notice how Waves 1, 3, and 5 are make up of smaller 5-wave impulse patterns, but Waves 2 and 4 are make up of smaller 3-wave corrective patterns?
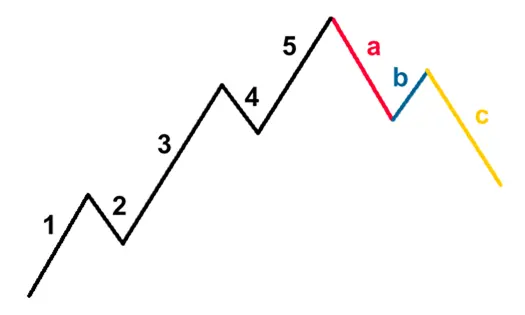
3-wave countertrends then correct and reverse the 5-wave trends. To track the correction, letters are utilized instead of numbers. Take a look at this smokin' hot corrective 3-wave pattern!
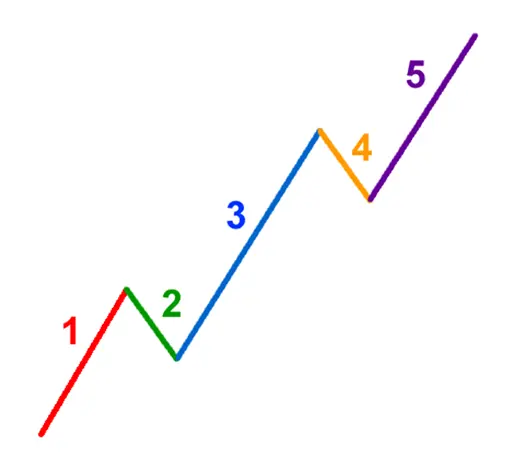
Impulse waves are the first five-wave pattern. Corrective waves are the last three waves of the pattern.

Ralph Nelson Elliott, a mad genius and professional accountant from the 1920s and 1930s, was a legend in his time. Elliott discovered that stock markets, which were thought to behave in a somewhat chaotic manner, didn't. He did this by analyzing 75 years' worth of stock data.

A candlestick chart, or Heikin Ashi, is a sort of price chart that uses candlesticks. Japanese candlesticks that have been modified. A Heikin Ashi chart filters out market noise and gives you a clearer picture of the trend.