Limitations of Heikin Ashi
Heikin Ashi, like any other technical analysis tool, is beneficial, but it does have some flaws or limitations.
Elementary School
简体中文
繁體中文
English
Pусский
日本語
ภาษาไทย
Tiếng Việt
Bahasa Indonesia
Español
हिन्दी
Filippiiniläinen
Français
Deutsch
Português
Türkçe
한국어
العربية

Heikin Ashi, like any other technical analysis tool, is beneficial, but it does have some flaws or limitations.
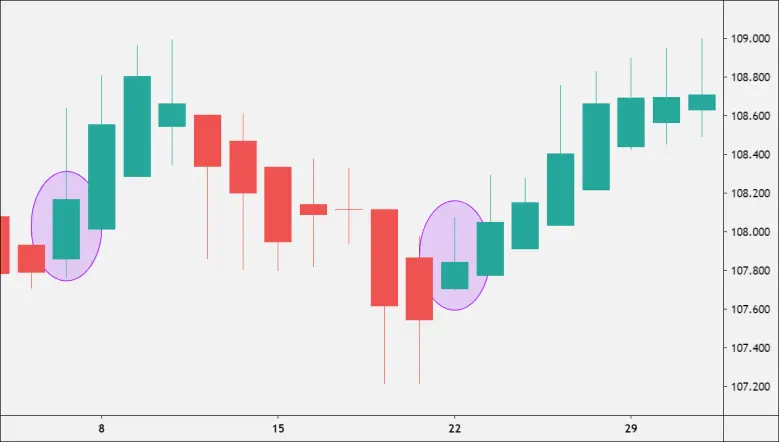
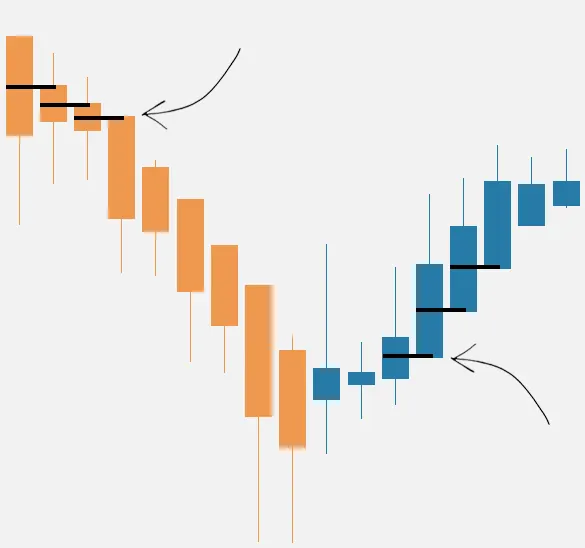
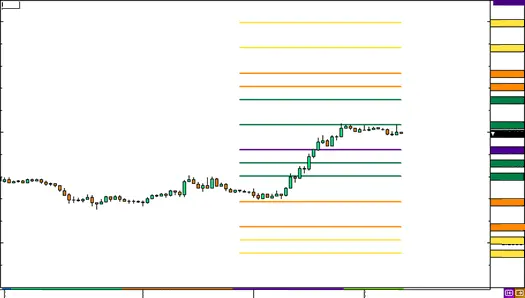
Using a Heikin Ashi chart, as described in a prior course, makes identifying trends easier. Traders can use Heikin Ashi to seek for the introduction of new trends or the reversal of existing trends. Heikin Ashi charts can be used in five different ways in trading.
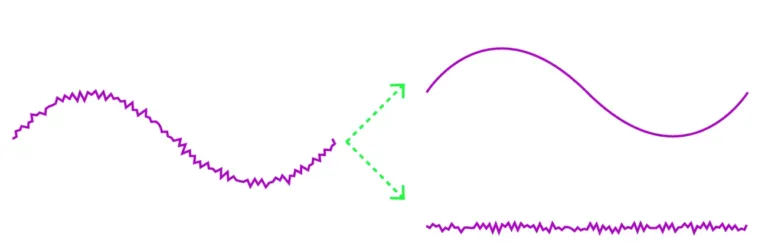
What is your approach to Heikin Ashi? Let's talk about how to use and understand a Heikin Ashi candlestick chart now that you know how to calculate Heikin Ashi candlesticks. The purpose of a Heikin Ashi chart is to filter out market noise.

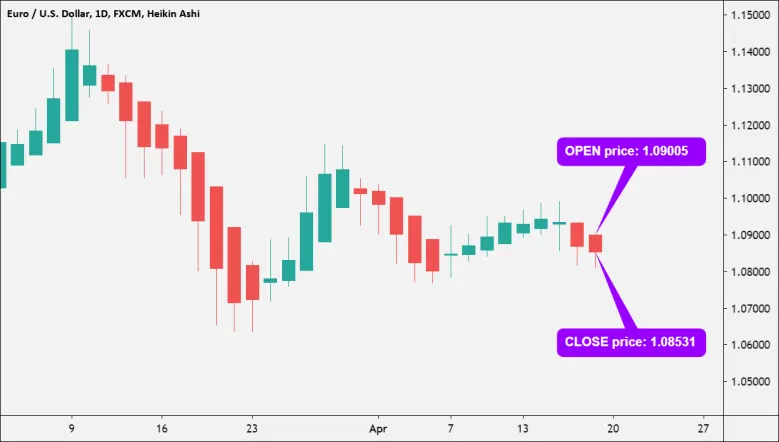
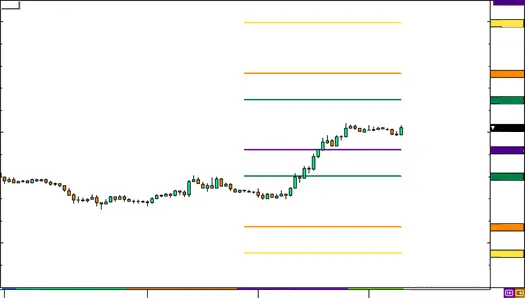
How is Heikin Ashi calculated? Let's have a look at how Heikin Ashi candlesticks are calculated and displayed on a graph.
What distinguishes Heikin Ashi from an average candlestick? Let's compare and contrast a Heikin Ashi candlestick chart with an average Japanese candlestick chart.

The three most common chart types are probably familiar to you: line chart, bar chart, and candlestick chart. However, there is another form of chart that you should be aware of, which employs a completely different technique of displaying price activity. The Heikin Ashi is a Japanese measurement system.
Pivot points are extremely popular with traders, they are used to spot direction, probable reversal points and potential support and resistance levels.
Standard method of calculating pivot points seems to be mentioned more often, But this is not the only type of pivot points that are existing. There are three other types to it as well. In this lesson, we shall cover the four different types of pivot points that exist.
There is nothing more essential to a trader than knowing what everyone is thinking in the market. One way to achieve that is to use pivot points indicator to estimate the current market sentiment.
One tool that provides forex traders with potential support and resistance levels and helps to minimize risk is the pivot point and its derivatives. Similar to your normal support and resistance levels, pivot point levels won’t hold forever.

Range trading is an active investing strategy that identifies a range at which the investor buys and sells at over a short period.
The pivot point indicator can be added to a chart, and the levels will automatically be calculated. You can also calculate them yourself, bear in mind that pivot points are predominantly used by day traders and are based on the high, low, and close from the prior trading day.
One tool that provides forex traders with potential support and resistance levels and helps to minimize risk is the pivot point and its derivatives. The use of reference points such as support and resistance, help determine when to enter the market, place stops, and take profits.

The main classic chart patterns are mentioned here, along with when they are formed, what type of signal they provide, and what the next expected price move is.

Reversal patterns are chart formations that indicate that a current trend is poised to shift direction.
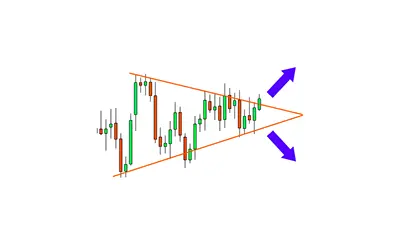
The triangular pattern is grouped as a "continuation pattern," which means that immediately the pattern is completed, the price is expected to continue in the trend direction in which it was traveling before the pattern take place.

Pennants, like rectangles, are continuation chart patterns that form following big advances. Buyers and sellers often take a breather after a large upward or negative move before continuing to move the pair in the same direction.

When the price is bordered by parallel support and resistance levels, a rectangle is produced on the chart. A rectangle represents a moment of consolidation or hesitation between buyers and sellers as they trade punches but neither has the upper hand.
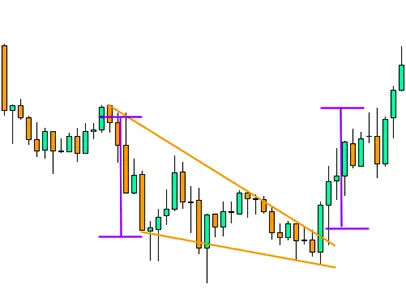
Two trend lines converge in a Wedge chart pattern. This indicates that the size of price fluctuation within the Wedge pattern is shrinking. Wedges designate a break in the current trend.

A reversal pattern, the head and shoulders chart pattern is most commonly observed in uptrends. "Head and shoulders" is well-known not only for trend reversals, but also for dandruff reversals.